
Logging Evaluations
Estimated Time: 3 minutes
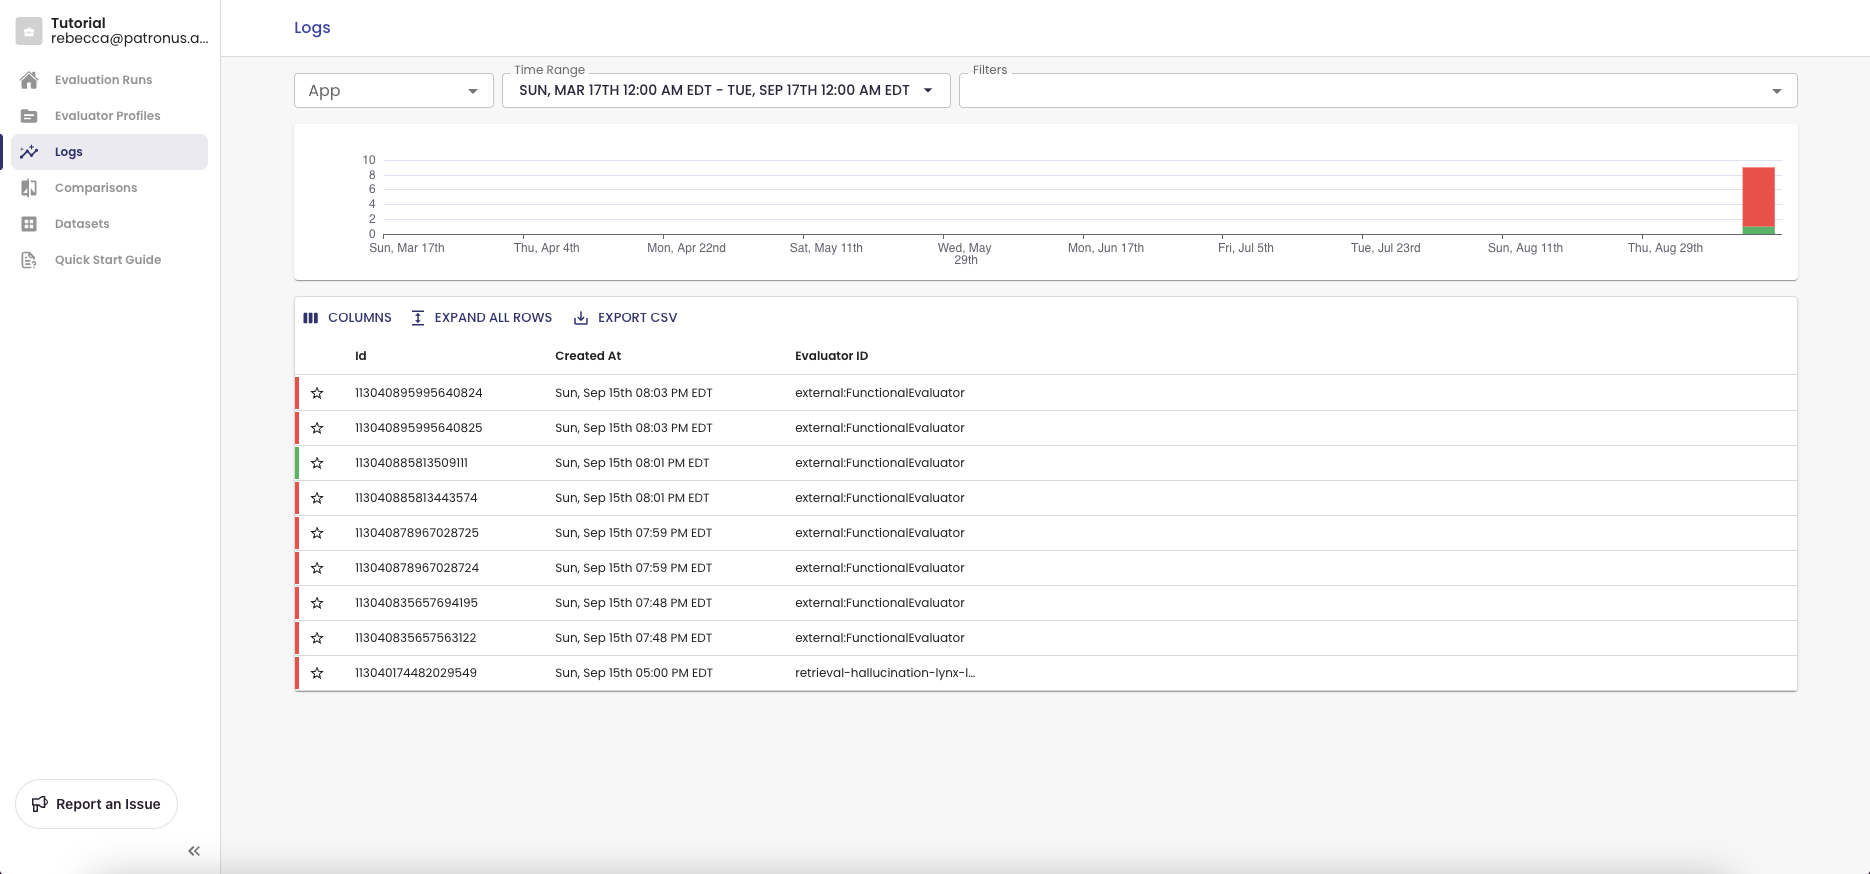
The Logs dashboard on our web application shows you results of LLM evaluations. To enable logging, set the capture parameter to all (default) or on-fail (failures only) to the /v1/evaluate endpoint.
Example of a simple API call with the following data payload:
data = {
  "evaluators": [
    {"evaluator": "retrieval-hallucination"},
    {"evaluator": "retrieval-answer-relevance"},
  ],
  "evaluated_model_input": "How do I deposit a check at the bank?",
  "evaluated_model_retrieved_context": [
            "To deposit a check at the bank, you should first go to your nearest bank branch. You should find an attendant upon arrival and hand them your check. They will then process the check and deposit the funds into your account.",
            "You can also deposit a check at an ATM or through your bank's mobile app.",
            "Remember to sign the back of the check before depositing it.",
        ],
  "evaluated_model_output": "You can deposit a check by either going to your nearest bank branch, an ATM, or through your bank's mobile app.",
  "app": "demo_retrieval_banking",
  "capture": "all",
  "tags": {"model": "gpt-4"},
}
response = requests.post(
  "https://api.patronus.ai/v1/evaluate", headers=headers, json=data
)
response.raise_for_status()
Filtering Results
As you log more calls to the API, you will find it useful to segment and filter logs. For example, you may want to:
- Drill down on different projects or use cases
- Understand performance for different models and parameters to check how that affects performance.
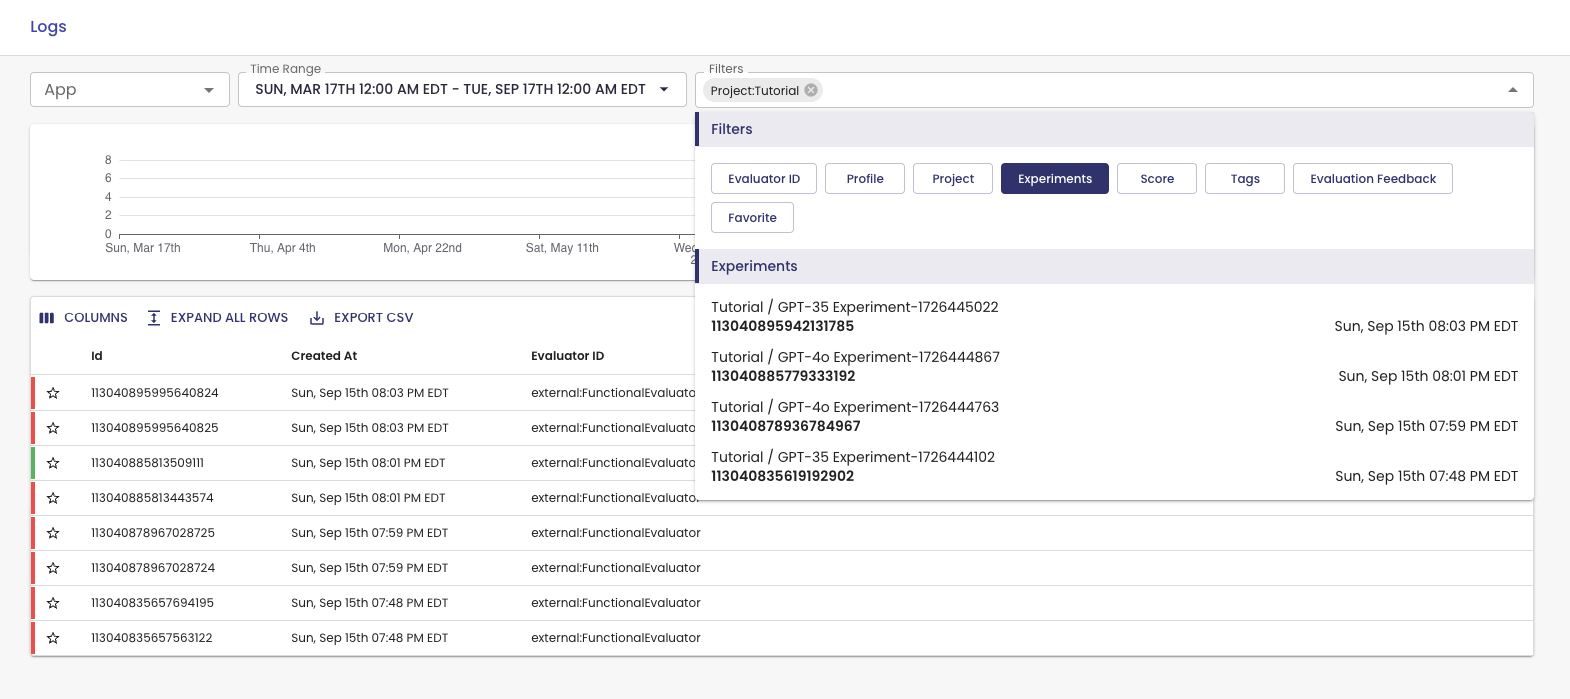
You can set the following filters:
- App name: This is useful for differentiating between projects or use cases. In the Logs view, you would select the app in the top left to only view results from that app. The default app name is "default" and this will be set when you do not provide an app name in your API call.
- Time range: You can choose a time range for queries you are interested. That allows you to focus on whatever dates are most relevant to you.
- Evaluator: Selecting specific evaluation criteria you are interested lets you focus on what you are evaluating for. You can select multiple criteria at a time.
- Pass result: All evaluators return a PASS/FAIL result. By filtering the results this way, you can focus only on failures for instance if that is what you are interested in.
- Tags: You can provide a dictionary of key value pairs in the API call (as shown above) to tag evaluations with metadata, such as the model version. You can then filter results by these key value pairs.
- Experiments: Select an experiment name to view logs for that run.
- Feedback and favorites: You can give feedback or favorite logs, and filter these logs for later use.
Export CSV
Once you've filtered the view to what you are interested, you can click into a detailed view or export the CSV. To export a CSV, all you need to do is click the button Export CSV on the UI and voilà!
This can be helpful if you want to save your records locally or if you would like to perform analysis in some other environment. You could also filter for failed evaluation outputs and construct either a new benchmark to see how your model is improving or use those downloaded samples as a fine-tuning dataset in case you're interested in fine-tuning on failed example.
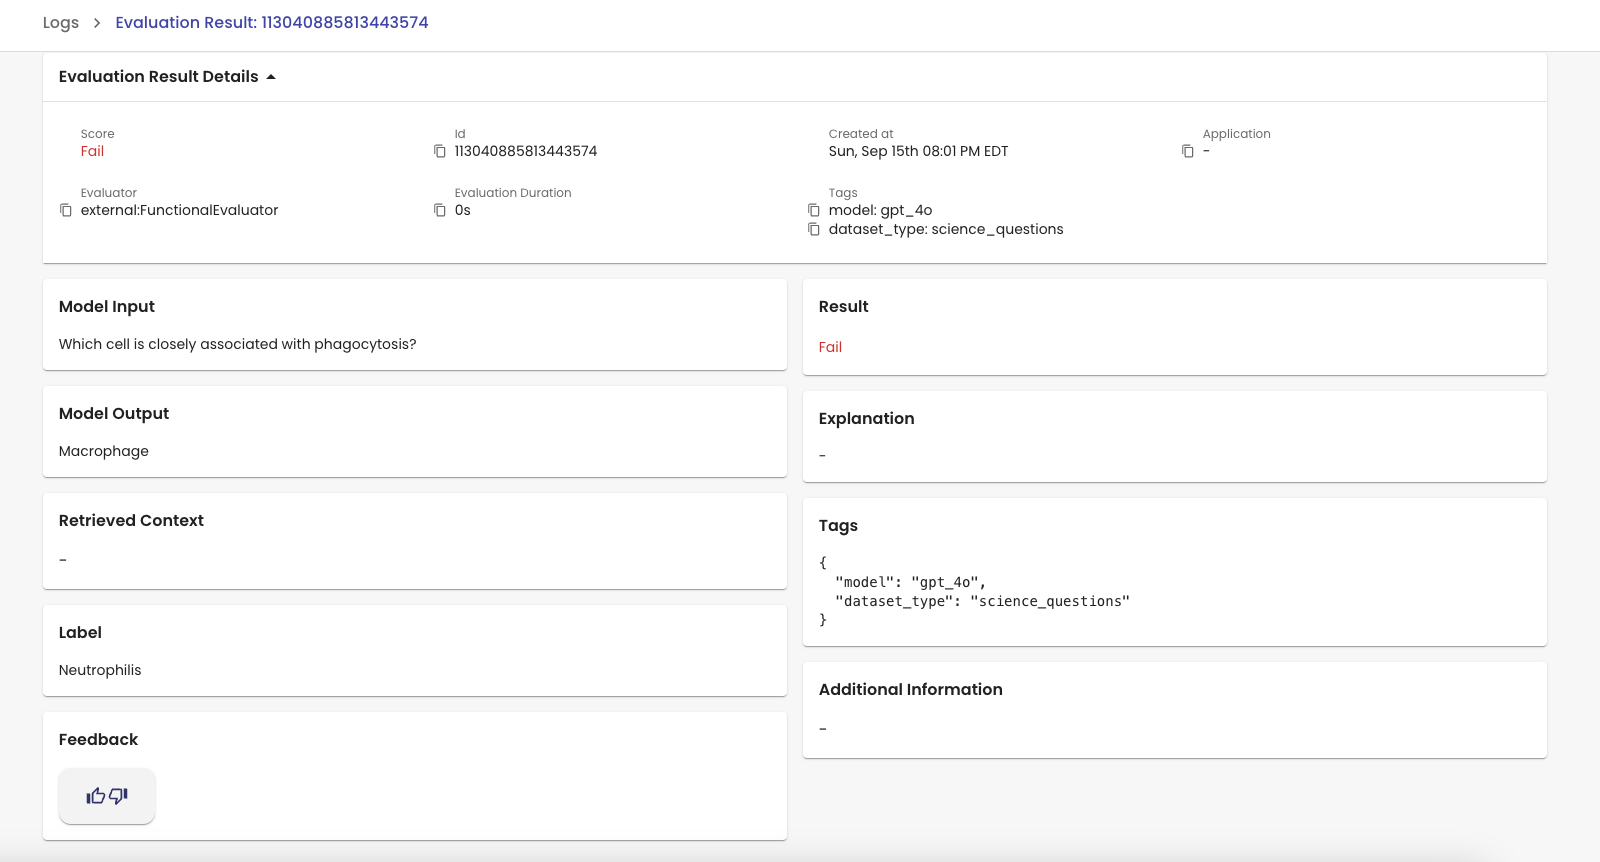
Detailed View
Each evaluation instance (one LLM output evaluated by a specific evaluator) gets its own row in the dashboard. You can view the results and all additional details by clicking on the row in question. You can also expand that row into a detailed informational page if you want an easier view to inspect as shown below.
Updated 3 days ago